 急躁的乌力力wXiI查看:48 回复:1 评论:0 创建时间:2023-01-05T09:41:59
用户:急躁的乌力力wXiI查看:48 回复:1 评论:0 创建时间:2023-01-05T09:41:59
【作品展示】
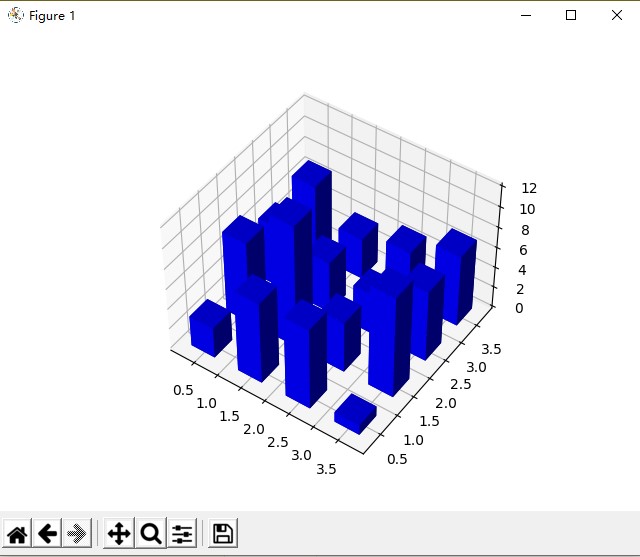
【作品介绍】
一个3d模型而已
【作品源代码】
from mpl_toolkits.mplot3d import Axes3D
import matplotlib.pyplot as plt
import numpy as np

fig = plt.figure()
ax = fig.add_subplot(111, projection='3d')
x, y = np.random.rand(2, 100) * 4
hist, xedges, yedges = np.histogram2d(x, y, bins=4, range=[[0, 4], [0, 4]])

# Construct arrays for the anchor positions of the 16 bars.
# Note: np.meshgrid gives arrays in (ny, nx) so we use 'F' to flatten xpos,
# ypos in column-major order. For numpy >= 1.7, we could instead call meshgrid
# with indexing='ij'.
xpos, ypos = np.meshgrid(xedges[:-1] + 0.25, yedges[:-1] + 0.25)
xpos = xpos.flatten('F')
ypos = ypos.flatten('F')
zpos = np.zeros_like(xpos)

# Construct arrays with the dimensions for the 16 bars.
dx = 0.5 * np.ones_like(zpos)
dy = dx.copy()
dz = hist.flatten()

ax.bar3d(xpos, ypos, zpos, dx, dy, dz, color='b', zsort='average')

plt.show()
【提示】
部分含有Python第三方库相关内容的作品,在海龟编辑器网页端无法运行哦!如遇到这种情况,可以打开下面的链接,下载海龟编辑器客户端:
https://python.codemao.cn