 振华查看:18 回复:0 评论:0 创建时间:2023-01-03T18:40:57
用户:
只要有上过学的,都知道统计图是个什么东东()()
import matplotlib as mpl
import matplotlib.pyplot as plt
import numpy as np
import math
import time
import datetime


def no5(title_1, ii, ii1, ii2):
    """
    堆积折线图
    :return:
    """
    x = np.arange(1, 4, 1)
    y = [ii, ii1, ii2]
    labels = [title_1]
    colors = ['#8da0cb']
    plt.stackplot(x, y, labels=labels, colors=colors)
    plt.legend(loc="upper left")
    plt.show()


print("程序启动")
print("接下来,你需要输入一些数据")
o = 0
while o == 0:
    try:
        o = 0
        title1 = input("请输入一个数据标题:")
        i = int(input("请输入第一组数据:"))
        i1 = int(input("请输入第二组数据:"))
        i2 = int(input("请输入第三组数据:"))
        no5(title1, i, i1, i2)
        o = 3
    except:
        print("输入有误!")
        print("请重新输入:")
        o = 0
以上的代码,我(自豪的)将其称为:宇宙超级喵前无古人后无来者的智能(喵)统计图生成器!!!!!!!
(虽然网上有许多高级到不能再高级的统计图生成器。。。。。)

好了,不废话,直接看效果
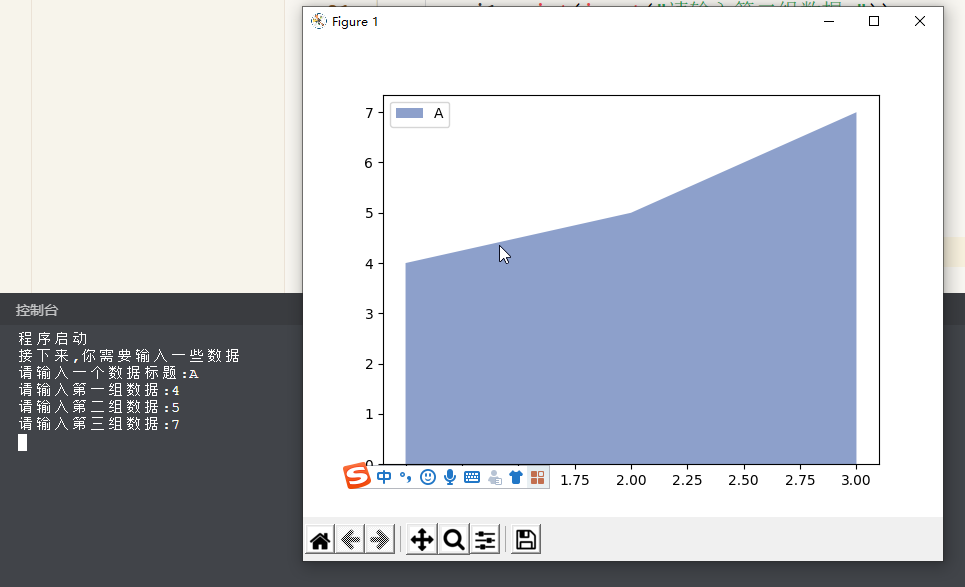
额,好像有点鸡肋。。()()()()()