 温润的彗星猫9CjQ查看:0 回复:0 评论:0 创建时间:2022-12-24T22:28:55
用户:温润的彗星猫9CjQ查看:0 回复:0 评论:0 创建时间:2022-12-24T22:28:55
【作品展示】
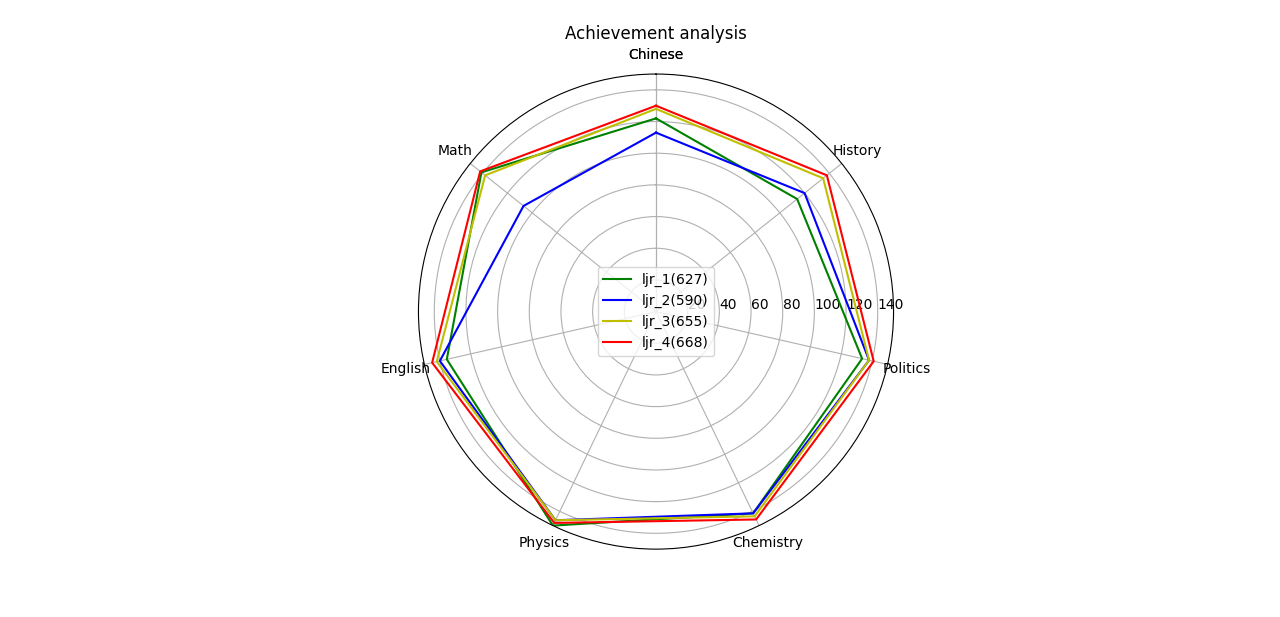
【作品介绍】
考试成绩分析,输入你的成绩,生成对应的雷达图,分析才能更好地学习
【作品源代码】
import matplotlib.pyplot as plt
import numpy as np
# 注意是150分制,把分数都换成满分150

results = [{"Chinese": 1, "Math": 1, "English": 1, "Physics": 15, "Chemistry": 141, "Politics": 13, "History": 14},
           {"Chinese": 1, "Math": 1, "English": 1, "Physics": 14,"Chemistry": 141, "Politics": 13, "History": 20},
           {"Chinese": 1, "Math": 1, "English": 12, "Physics": 14,"Chemistry": 143, "Politics": 13, "History": 35},
           {"Chinese": 1, "Math": 1, "English": 14, "Physics": 14, "Chemistry": 145, "Politics": 14, "History": 38}]
data_length = len(results[0])

angles = np.linspace(0, 2*np.pi, data_length, endpoint=False)
labels = [key for key in results[0].keys()]
score = [[v for v in result.values()] for result in results]

score_a = np.concatenate((score[0], [score[0][0]]))
score_b = np.concatenate((score[1], [score[1][0]]))
score_c = np.concatenate((score[2], [score[2][0]]))
score_d = np.concatenate((score[3], [score[3][0]]))
angles = np.concatenate((angles, [angles[0]]))
labels = np.concatenate((labels, [labels[0]]))

fig = plt.figure(figsize=(5, 3), dpi=100)

ax = plt.subplot(111, polar=True)

ax.plot(angles, score_a, color='g')
ax.plot(angles, score_b, color='b')
ax.plot(angles, score_c, color='y')
ax.plot(angles, score_d, color='r')

ax.set_thetagrids(angles*180/np.pi, labels)

ax.set_theta_zero_location('N')

ax.set_rlim(0, 150)

ax.set_rlabel_position(270)
ax.set_title("Achievement analysis")
plt.legend(["1()", "2()", "3()", "4()",], loc='best')
plt.show()
【提示】
部分含有Python第三方库相关内容的作品,在海龟编辑器网页端无法运行哦!如遇到这种情况,可以打开下面的链接,下载海龟编辑器客户端:
https://python.codemao.cn