 和蔼的疾电猴I-3S查看:0 回复:0 评论:0 创建时间:2021-10-24T10:14:34
用户:和蔼的疾电猴I-3S查看:0 回复:0 评论:0 创建时间:2021-10-24T10:14:34
【作品展示】
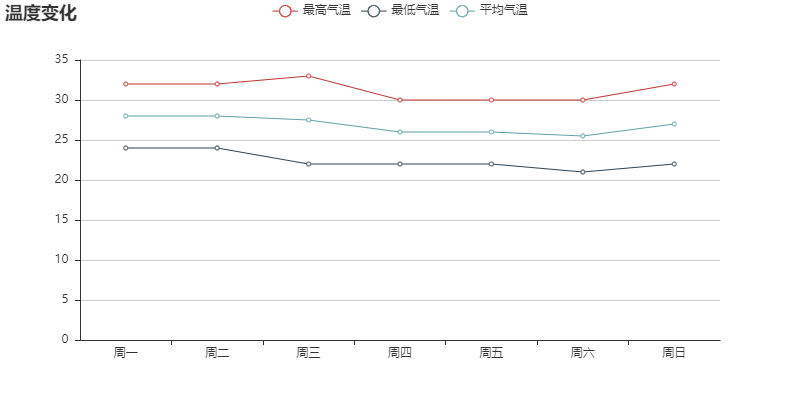
【作品介绍】
温度折线图,欢迎评价~
【作品源代码】
import json
from pyecharts import Line
import webbrowser
import os
with open("weather.json","r")as f:
    data = json.load(f)
#print(data)
mean_temp = data["mean_temp"]
high_temp = data["high_temp"]
low_temp = data["low_temp"]
#print(mean_temp)
x_axis = ['周一', '周二', '周三', '周四', '周五', '周六', '周日']
line = Line("温度变化")
line.add("最高气温",x_axis,high_temp)
line.add( "最低气温",x_axis,low_temp, yaxis_formatter="°C",mark_point=["max","min"])
line.add("平均气温",x_axis,mean_temp)
line.render()
webbrowser.open("file://"+os.path.realpath("render.html"))
【提示】
部分含有Python第三方库相关内容的作品,在海龟编辑器网页端无法运行哦!如遇到这种情况,可以打开下面的链接,下载海龟编辑器客户端:
https://python.codemao.cn