 墨语Clyi查看:0 回复:0 评论:0 创建时间:2021-07-31T11:46:36
用户:
【作品展示】
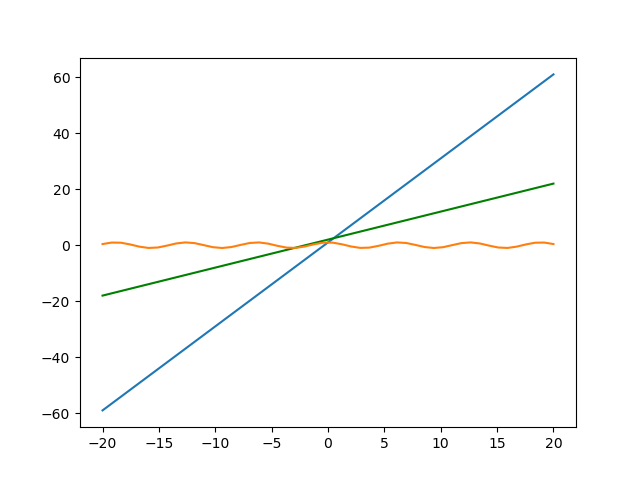
【作品介绍】
根据老师的提示按照步骤来就好啦
【作品源代码】
import matplotlib.pyplot as ma
import numpy as np
x=np.linspace(-20,20,50)
y1=3*x+1
y2=x+2
y3=np.cos(x)
ma.figure
ma.plot(x,y1)
ma.figure
ma.plot(x,y2,color="green")
ma.plot(x,y3)
ma.show()
【提示】
部分含有Python第三方库相关内容的作品,在海龟编辑器网页端无法运行哦!如遇到这种情况,可以打开下面的链接,下载海龟编辑器客户端:
https://python.codemao.cn